Turtle Soup ICT Strategy [TradingFinder] FVG + CHoCH/CSD🔵 Introduction
The ICT Turtle Soup trading setup, designed in the ICT style, operates by hunting or sweeping liquidity zones to exploit false breakouts and failed breakouts in key liquidity Zones, such as recent highs, lows, or major support and resistance levels.
This setup identifies moments when the price breaches these liquidity zones, triggering stop orders placed (Stop Hunt) by other traders, and then quickly reverses direction. These movements are often associated with liquidity sweeps that create temporary market imbalances.
The reversal is typically confirmed by one of three structural shifts : a Market Structure Shift (MSS), a Change of Character (CHoCH), or a break of the Change in State of Delivery (CISD). Each of these structural shifts provides a reliable signal to interpret market intent and align trading decisions with the expected price movement. After the structural shift, the price frequently pullback to a Fair Value Gap (FVG), offering a precise entry point for trades.
By integrating key concepts such as liquidity, liquidity sweeps, stop order activation, structural shifts (MSS, CHoCH, CISD), and price imbalances, the ICT Turtle Soup setup enables traders to identify reversal points and key entry zones with high accuracy.
This strategy is highly versatile, making it applicable across markets such as forex, stocks, cryptocurrencies, and futures. It offers traders a robust and systematic approach to understanding price movements and optimizing their trading strategies
🟣 Bullish and Bearish Setups
Bullish Setup : The price first sweeps below a Sell-Side Liquidity (SSL) zone, then reverses upward after forming an MSS or CHoCH, and finally pulls back to an FVG, creating a buying opportunity.
Bearish Setup : The price first sweeps above a Buy-Side Liquidity (BSL) zone, then reverses downward after forming an MSS or CHoCH, and finally pulls back to an FVG, creating a selling opportunity.
🔵 How to Use
To effectively utilize the ICT Turtle Soup trading setup, begin by identifying key liquidity zones, such as recent highs, lows, or support and resistance levels, in higher timeframes.
Then, monitor lower timeframes for a Liquidity Sweep and confirmation of a Market Structure Shift (MSS) or Change of Character (CHoCH).
After the structural shift, the price typically pulls back to an FVG, offering an optimal trade entry point. Below, the bullish and bearish setups are explained in detail.
🟣 Bullish Turtle Soup Setup
Identify Sell-Side Liquidity (SSL) : In a higher timeframe (e.g., 1-hour or 4-hour), identify recent price lows or support levels that serve as SSL zones, typically the location of stop-loss orders for traders.
Observe a Liquidity Sweep : On a lower timeframe (e.g., 15-minute or 30-minute), the price must move below one of these liquidity zones and then reverse. This movement indicates a liquidity sweep.
Confirm Market Structure Shift : After the price reversal, look for a structural shift (MSS or CHoCH) indicated by the formation of a Higher Low (HL) and Higher High (HH).
Enter the Trade : Once the structural shift is confirmed, the price typically pulls back to an FVG. Enter a buy trade in this zone, set a stop-loss slightly below the recent low, and target Buy-Side Liquidity (BSL) in the higher timeframe for profit.
🟣 Bearish Turtle Soup Setup
Identify Buy-Side Liquidity (BSL) : In a higher timeframe, identify recent price highs or resistance levels that serve as BSL zones, typically the location of stop-loss orders for traders.
Observe a Liquidity Sweep : On a lower timeframe, the price must move above one of these liquidity zones and then reverse. This movement indicates a liquidity sweep.
Confirm Market Structure Shift : After the price reversal, look for a structural shift (MSS or CHoCH) indicated by the formation of a Lower High (LH) and Lower Low (LL).
Enter the Trade : Once the structural shift is confirmed, the price typically pulls back to an FVG. Enter a sell trade in this zone, set a stop-loss slightly above the recent high, and target Sell-Side Liquidity (SSL) in the higher timeframe for profit.
🔵 Settings
Higher TimeFrame Levels : This setting allows you to specify the higher timeframe (e.g., 1-hour, 4-hour, or daily) for identifying key liquidity zones.
Swing period : You can set the swing detection period.
Max Swing Back Method : It is in two modes "All" and "Custom". If it is in "All" mode, it will check all swings, and if it is in "Custom" mode, it will check the swings to the extent you determine.
Max Swing Back : You can set the number of swings that will go back for checking.
FVG Length : Default is 120 Bar.
MSS Length : Default is 80 Bar.
FVG Filter : This refines the number of identified FVG areas based on a specified algorithm to focus on higher quality signals and reduce noise.
Types of FVG filter s:
Very Aggressive Filter: Adds a condition where, for an upward FVG, the last candle's highest price must exceed the middle candle's highest price, and for a downward FVG, the last candle's lowest price must be lower than the middle candle's lowest price. This minimally filters out FVGs.
Aggressive Filter: Builds on the Very Aggressive mode by ensuring the middle candle is not too small, filtering out more FVGs.
Defensive Filter: Adds criteria regarding the size and structure of the middle candle, requiring it to have a substantial body and specific polarity conditions, filtering out a significant number of FVGs.
Very Defensive Filter: Further refines filtering by ensuring the first and third candles are not small-bodied doji candles, retaining only the highest quality signals.
In the indicator settings, you can customize the visibility of various elements, including MSS, FVG, and HTF Levels. Additionally, the color of each element can be adjusted to match your preferences. This feature allows traders to tailor the chart display to their specific needs, enhancing focus on the key data relevant to their strategy.
🔵 Conclusion
The ICT Turtle Soup trading setup is a powerful tool in the ICT style, enabling traders to exploit false breakouts in key liquidity zones. By combining concepts of liquidity, liquidity sweeps, market structure shifts (MSS and CHoCH), and pullbacks to FVG, this setup helps traders identify precise reversal points and execute trades with reduced risk and increased accuracy.
With applications across various markets, including forex, stocks, crypto, and futures, and its customizable indicator settings, the ICT Turtle Soup setup is ideal for both beginner and advanced traders. By accurately identifying liquidity zones in higher timeframes and confirming structure shifts in lower timeframes, this setup provides a reliable strategy for navigating volatile market conditions.
Ultimately, success with this setup requires consistent practice, precise market analysis, and proper risk management, empowering traders to make smarter decisions and achieve their trading goals.
在腳本中搜尋"stop loss"

ka66: Candle Range MarkThis is a simple trailing stop loss tool using bar ranges, to be used with some discretion and understanding of basic price action.
Given a configurable percentage value, e.g. 25%:
A bullish bar (close > open) will be marked at the lower 25%
A bearish bar (close < open) will be marked at the upper 25%
The idea is to move your stop loss after each completed bar in the direction of the trade, at the configured percentage value.
If you have an inside bar, or something very close to it, or a doji-type bar, don't trail that, because there is no clarity of what the bar means, we can only wait.
The chart shows an example use, with trailing at 10% of the bar, from the initial stop loss after entry, trailing till we get stopped out. Some things to note:
Because this example focuses on a short trade, we ignore the bullish candles, and keep our trailing stop at the last bearish candle.
We ignore doji-esque candles and inside bars, where the body is in the range of the prior candle. Some definitions of inside bars include the wicks as well. I don't have a strong opinion, and this example is just for illustration. Furthermore, the inside bar will likely be the opposite of the swing bars (e.g. bullish bar in a range of bearish bars), so our stop remains unchanged.
One could use this semi-systematic approach in scalping on any timeframe, for example to maximise gains, adjusting the bar percentage as needed.

Daily Single Trade [SMRT Algo]The Daily Single Trade Indicator by SMRT Algo is a powerful yet simple tool designed for traders who value precision, discipline, and a focus on high-quality trade setups. With a unique approach, this indicator identifies just one signal daily, making it ideal for traders who prefer a structured and stress-free trading routine.
Please note that this indicator only works for timeframes below 1H.
Key Features:
Market Open & Pre-Market Analysis: The indicator focuses on the market’s opening range and identifies breakout opportunities based on price action during these critical periods.
Customizable Risk-Reward Ratio: Plan your trades with precision by setting your desired RR, ensuring that your take-profit (TP) levels are multiples of your stop-loss (SL). Stop loss is not shown with this indicator.
Price Offset for SL: Add a customizable buffer to your SL and TP levels. This offset accounts for market volatility, reducing the chances of premature stop-outs while maintaining alignment with your trading plan.
Increasing this value will lead to a greater invisible stop loss, which will increase the TP size. The opposite is occurs when decreasing this value (less than 0). If you set it as 2.5 for example for TSLA: price is 340 and SL is 330 for example, SL becomes 327.5. This calculation will then be applied to calculate the TP.
In simple terms, if the offset is positive, SL becomes larger, TP becomes larger as well.
Exit Point Visibility: Display exit points on your chart to better visualize trade targets and stop levels.
Adjustable Market Open Time: Easily modify the market open hour and minute to suit your asset’s trading session. For example, U.S. stock traders can set the market open time to 9:30 AM EST (UTC-5).
By providing a single signal each day, the indicator minimizes overtrading and keeps your focus on the best opportunities.
With predefined SL, TP, and RR settings, the indicator fosters disciplined trading, reducing the influence of emotional decision-making. Whether you’re trading stocks, indices, or forex, the customizable market open time and RR ratio make this indicator versatile and adaptable.
The combination of precise SL and TP calculations with offset pip adjustments helps protect your trades from market noise while maintaining a favorable RR.
Perfect for those who can’t monitor markets all day, the single-signal approach allows you to execute a high-quality trade and move on with your day.
How to Use:
Set the Market Open Time: Adjust the open time to align with your asset’s session. For example, set 9:30 AM EST for U.S. stocks.
Define Your Risk-Reward Ratio: Choose an RR multiple (e.g., 1:2 or 1:3) that aligns with your risk tolerance and trading goals.
Apply Pip Offset: Add a buffer to your SL and TP to account for market volatility and reduce false stops.
The Daily Single Trade Indicator simplifies trading by focusing on one high-probability setup per day. It’s perfect for traders looking to maintain consistency, improve risk management, and reduce the stress of overanalyzing the markets.
How Alerts Work:
Individual Alerts: Set separate notifications for specific actions, such as breakout signals, take-profit levels, or stop-loss activations.
Master Alert: Manage all notifications with one streamlined setting, ensuring you never miss an opportunity while keeping your setup simple and efficient.
Take control of your trading with a strategy built for clarity, precision, and success!

ADM Indicator [CHE] Comprehensive Description of the Three Market Phases for TradingView
Introduction
Financial markets often exhibit patterns that reflect the collective behavior of participants. Recognizing these patterns can provide traders with valuable insights into potential future price movements. The ADM Indicator is designed to help traders identify and capitalize on these patterns by detecting three primary market phases:
1. Accumulation Phase
2. Manipulation Phase
3. Distribution Phase
This indicator places labels on the chart to signify these phases, aiding traders in making informed decisions. Below is an in-depth explanation of each phase, including how the ADM Indicator detects them.
1. Accumulation Phase
Definition
The Accumulation Phase is a period where informed investors or institutions discreetly purchase assets before a potential price increase. During this phase, the price typically moves within a confined range between established highs and lows.
Characteristics
- Price Range Bound: The asset's price stays within the previous high and low after a timeframe change.
- Low Volatility: Minimal price movement indicates a balance between buyers and sellers.
- Steady Volume: Trading volume may remain relatively constant or show slight increases.
- Market Sentiment: General market interest is low, as the accumulation is not yet apparent to the broader market.
Detection with ADM Indicator
- Criteria: An accumulation is detected when the price remains within the previous high and low after a timeframe change.
- Indicator Action: At the end of the period, if accumulation has occurred, the indicator places a label "Accumulation" on the chart.
- Visual Cues: A yellow semi-transparent background highlights the accumulation phase, enhancing visual recognition.
Implications for Traders
- Entry Opportunity: Consider preparing for potential long positions before a possible upward move.
- Risk Management: Use tight stop-loss orders below the support level due to the defined trading range.
2. Manipulation Phase
Definition
The Manipulation Phase, also known as the Shakeout Phase, occurs when dominant market players intentionally move the price to trigger stop-loss orders and create panic among less-informed traders. This action generates liquidity and better entry prices for large positions.
Characteristics
- False Breakouts: The price moves above the previous high or below the previous low but quickly reverses.
- Increased Volatility: Sharp price movements occur without fundamental reasons.
- Stop-Loss Hunting: The price targets common stop-loss areas, triggering them before reversing.
- Emotional Trading: Retail traders may react impulsively, leading to poor trading decisions.
Detection with ADM Indicator
- Manipulation Up:
- Criteria: Detected when the price rises above the previous high and then falls back below it.
- Indicator Action: Places a label "Manipulation Up" on the chart at the point of detection.
- Manipulation Down:
- Criteria: Detected when the price falls below the previous low and then rises back above it.
- Indicator Action: Places a label "Manipulation Down" on the chart at the point of detection.
- Visual Cues:
- Manipulation Up: Blue background highlights the phase.
- Manipulation Down: Orange background highlights the phase.
Implications for Traders
- Caution Advised: Be wary of false signals and avoid overreacting to sudden price changes.
- Preparation for Next Phase: Use this phase to anticipate potential distribution and adjust strategies accordingly.
3. Distribution Phase
Definition
The Distribution Phase occurs when the institutions or informed investors who accumulated positions start selling to the general market at higher prices. This phase often follows a Manipulation Phase and may signal an impending trend reversal.
Characteristics
- Price Reversal: The price moves in the opposite direction of the prior manipulation.
- High Trading Volume: Increased selling activity as large players offload positions.
- Trend Weakening: The previous trend loses momentum, indicating a potential shift.
- Market Sentiment Shift: Optimism fades, and uncertainty or pessimism may emerge.
Detection with ADM Indicator
- Distribution Up:
- Criteria: Detected after a verified Manipulation Up when the price subsequently falls below the previous low.
- Indicator Action: Places a label "Distribution Up" on the chart.
- Distribution Down:
- Criteria: Detected after a verified Manipulation Down when the price subsequently rises above the previous high.
- Indicator Action: Places a label "Distribution Down" on the chart.
- Visual Cues:
- Distribution Up: Purple background highlights the phase.
- Distribution Down: Maroon background highlights the phase.
Implications for Traders
- Exit Signals: Consider closing long positions if in a Distribution Up phase.
- Short Selling Opportunities: Potential to enter short positions anticipating a downtrend.
Using the ADM Indicator on TradingView
Indicator Overview
The ADM Indicator automates the detection of Accumulation, Manipulation, and Distribution phases by analyzing price movements relative to previous highs and lows on a selected timeframe. It provides visual cues and labels on the chart, helping traders quickly identify the current market phase.
Features
- Multi-Timeframe Analysis: Choose from auto, multiplier, or manual timeframe settings.
- Visual Labels: Clear labeling of market phases directly on the chart.
- Background Highlighting: Distinct background colors for each phase.
- Customizable Settings: Adjust colors, styles, and display options.
- Period Separators: Optional separators delineate different timeframes.
Interpreting the Indicator
1. Accumulation Phase
- Detection: Price stays within the previous high and low after a timeframe change.
- Label: "Accumulation" placed at the period's end if detected.
- Background: Yellow semi-transparent color.
- Action: Prepare for potential long positions.
2. Manipulation Phase
- Detection:
- Manipulation Up: Price rises above previous high and then falls back below.
- Manipulation Down: Price falls below previous low and then rises back above.
- Labels: "Manipulation Up" or "Manipulation Down" placed at detection.
- Background:
- Manipulation Up: Blue color.
- Manipulation Down: Orange color.
- Action: Exercise caution; avoid impulsive trades.
3. Distribution Phase
- Detection:
- Distribution Up: After a Manipulation Up, price falls below previous low.
- Distribution Down: After a Manipulation Down, price rises above previous high.
- Labels: "Distribution Up" or "Distribution Down" placed at detection.
- Background:
- Distribution Up: Purple color.
- Distribution Down: Maroon color.
- Action: Consider exiting positions or entering counter-trend trades.
Configuring the Indicator
- Timeframe Type: Select Auto, Multiplier, or Manual for analysis timeframe.
- Multiplier: Set a custom multiplier when using "Multiplier" type.
- Manual Resolution: Define a specific timeframe with "Manual" option.
- Separator Settings: Customize period separators for visual clarity.
- Label Display Options: Choose to display all labels or only the most recent.
- Visualization Settings: Adjust colors and styles for personal preference.
Practical Tips
- Combine with Other Analysis Tools: Use alongside volume indicators, trend lines, or other technical tools.
- Backtesting: Review historical data to understand how the indicator signals would have impacted past trades.
- Stay Informed: Keep abreast of market news that might affect price movements beyond technical analysis.
- Risk Management: Always employ stop-loss orders and position sizing strategies.
Conclusion
The ADM Indicator is a valuable tool for traders seeking to understand and leverage market phases. By detecting Accumulation, Manipulation, and Distribution phases through specific price action criteria, it provides actionable insights into market dynamics.
Understanding the precise conditions under which each phase is detected empowers traders to make more informed decisions. Whether preparing for potential breakouts during accumulation, exercising caution during manipulation, or adjusting positions during distribution, the ADM Indicator aids in navigating the complexities of the financial markets.
Disclaimer:
The content provided, including all code and materials, is strictly for educational and informational purposes only. It is not intended as, and should not be interpreted as, financial advice, a recommendation to buy or sell any financial instrument, or an offer of any financial product or service. All strategies, tools, and examples discussed are provided for illustrative purposes to demonstrate coding techniques and the functionality of Pine Script within a trading context.
Any results from strategies or tools provided are hypothetical, and past performance is not indicative of future results. Trading and investing involve high risk, including the potential loss of principal, and may not be suitable for all individuals. Before making any trading decisions, please consult with a qualified financial professional to understand the risks involved.
By using this script, you acknowledge and agree that any trading decisions are made solely at your discretion and risk.
This indicator is inspired by the Super 6x Indicators: RSI, MACD, Stochastic, Loxxer, CCI, and Velocity . A special thanks to Loxx for their relentless effort, creativity, and contributions to the TradingView community, which served as a foundation for this work.
Best regards Chervolino
Overview of the Timeframe Levels in the `autotimeframe()` Function
The `autotimeframe()` function automatically adjusts the higher timeframe based on the current chart timeframe. Here are the specific timeframe levels used in the function:
- Current Timeframe ≤ 1 Minute
→ Higher Timeframe: 240 Minutes (4 Hours)
- Current Timeframe ≤ 5 Minutes
→ Higher Timeframe: 1 Day
- Current Timeframe ≤ 1 Hour
→ Higher Timeframe: 3 Days
- Current Timeframe ≤ 4 Hours
→ Higher Timeframe: 7 Days
- Current Timeframe ≤ 12 Hours
→ Higher Timeframe: 1 Month
- Current Timeframe ≤ 1 Day
→ Higher Timeframe: 3 Months
- Current Timeframe ≤ 7 Days
→ Higher Timeframe: 6 Months
- For All Higher Timeframes (over 7 Days)
→ Higher Timeframe: 12 Months
Summary:
The function assigns a corresponding higher timeframe based on the current timeframe to optimize the analysis:
- 1 Minute or Less → 4 Hours
- Up to 5 Minutes → 1 Day
- Up to 1 Hour → 3 Days
- Up to 4 Hours → 7 Days
- Up to 12 Hours → 1 Month
- Up to 1 Day → 3 Months
- Up to 7 Days → 6 Months
- Over 7 Days → 12 Months
This automated adjustment ensures that the indicator works effectively across different chart timeframes without requiring manual changes.

Portfolio [Afnan]🚀 Portfolio - Advanced Portfolio Management Indicator 📊
A game-changing portfolio management tool designed to help traders stay on top of their positions and manage risk efficiently. This indicator combines detailed tracking, real-time analytics, and visual clarity to ensure traders are well-equipped for the dynamic world of financial markets.
📈 Key Features 💡
Track up to 14 positions with ease
Real-time Profit & Loss (P&L) updates and risk metrics
Visual representation of entry, stop-loss (SL), and target levels
Alerts for stop-loss breaches and target achievements
Comprehensive portfolio summaries for quick analysis
Customizable options to suit individual trading styles
🔍 Main Components ⚙️
📊 1. Position Tracking
Detailed position data: entry, stop-loss, target levels, and more
Real-time risk-reward ratios
Insights into position size and exposure percentages
Continuous updates on P&L in real-time
📉 2. Visual Indicators
Clear visual markers for entry, SL, and target prices
Price labels with detailed percentage changes
Indicators that show the current position's market status
💼 3. Portfolio Summary
Aggregate account values and exposure
Summarized P&L metrics across all positions
Risk management insights for better decision-making
Daily performance tracking to evaluate strategies
⚠️ 4. Alert System
Instant notifications for stop-loss breaches
Alerts when target prices are hit
Alerts operate for the current chart symbol
⚡ Customization Options 🎨
Show or hide specific data columns
Adjust the table's position and size for better visibility
Personalize color schemes and text styles
Switch between full portfolio view and single symbol focus
📱 How to Use 📝
Input your positions in the indicator's settings
Enable or disable specific positions dynamically
Customize display preferences to your liking
Set up alerts for proactive risk management
Monitor all your trading activities in one comprehensive dashboard
📌 Important Notes ℹ️
Compatible with any trading symbol
Updates seamlessly during market hours
Alerts are specific to the currently active chart symbol
Maximum capacity: 14 simultaneous positions
Created by: @AfnanTAjuddin
⚠️ Disclaimer ⚠️
This indicator is a tool for informational purposes only. Ensure all calculations are verified and consult a financial professional before making investment decisions.
🎯 "Stay disciplined, trade smart, and let data guide your decisions." 📊

Enhanced Trading Alerts# Enhanced Multi-Symbol EMA Trading System with Smart Alerts
## 📊 Overview
A powerful multi-symbol trading system that monitors up to 6 symbols simultaneously for high-probability trading setups using advanced EMA crossover strategies, enhanced with volume confirmation and RSI filters. Perfect for swing traders and position traders focusing on quality tech stocks.
## 🎯 Key Features
- **Multi-Symbol Monitoring**: Simultaneously tracks 6 different symbols
- **Advanced EMA Strategy**: Uses dual EMA system (320 & 820 periods) for trend confirmation
- **Volume Validation**: Confirms signals with volume surge analysis
- **RSI Filter**: Adds momentum confirmation to avoid false signals
- **Smart Risk Management**: Automatic stop-loss and take-profit calculations
- **Detailed Alerts**: Comprehensive alert messages with key price levels
## 📈 Trading Signals
### Buy Signals Generated When:
- Price crosses above the slow EMA (820)
- Fast EMA (320) confirms the trend
- RSI is in optimal range (not overbought)
- Volume surge confirms the movement
- Risk levels automatically calculated
### Sell Signals Generated When:
- Price crosses below the slow EMA (820)
- Fast EMA (320) confirms the downtrend
- RSI confirms momentum shift
- Volume surge validates the movement
## ⚙️ Customizable Parameters
- **EMA Lengths**: Adjust fast and slow EMA periods
- **Volume Threshold**: Set minimum volume surge multiplier
- **RSI Settings**: Customize overbought/oversold levels
- **Risk Management**: Adjustable stop-loss and take-profit percentages
- **Symbol Selection**: Choose any 6 symbols to monitor
## 🎨 Visual Elements
- Blue line: Fast EMA (320)
- Red line: Slow EMA (820)
- Purple line: RSI indicator
- Clear visual representation of trend changes
## 📱 Smart Alerts
Detailed alert messages include:
- Symbol name and signal type
- Current price level
- RSI value
- Stop-loss price
- Take-profit target
- Volume surge multiplier
## 💡 Best Practices
1. **Timeframe Selection**:
- Best suited for 1H, 4H, or Daily timeframes
- Can be adapted for swing or position trading
2. **Risk Management**:
- Use suggested stop-loss levels
- Follow take-profit targets
- Consider volume confirmation strength
3. **Multiple Chart Setup**:
- Create multiple instances for more symbols
- Group correlated assets together
- Use different alert sounds for different setups
## 🎓 Usage Tips
- Monitor strongest tech stocks for best results
- Combine with market sentiment analysis
- Use volume surge as quality filter
- Wait for all conditions to align before trading
- Consider overall market conditions
## ⚠️ Risk Warning
This indicator is for informational purposes only. Always conduct your own analysis and consider your risk tolerance before trading. Past performance does not guarantee future results.
## 📌 Version History
- v1.0: Initial release with multi-symbol support
- v1.1: Added volume surge confirmation
- v1.2: Enhanced alert system with risk levels
- v1.3: Added RSI filter and improved signal quality
## 🔄 Regular Updates
Subscribe to this script for regular updates and improvements. Feel free to suggest features in the comments section.
## 📗 Default Symbols
- TSLA (Tesla)
- NVDA (NVIDIA)
- AVGO (Broadcom)
- TSM (Taiwan Semiconductor)
- META (Meta Platforms)
- AMZN (Amazon)
You can customize these symbols to match your trading preferences.
Good luck trading! 🍀

Adaptive MA Crossover with ATR-Based Risk MarkersDescription:
The Cross MA Entry Indicator with ATR-Based Stop-Loss and Take-Profit Markers is a powerful tool designed to help traders identify trend-following opportunities while managing risk effectively. By combining customizable moving average (MA) crossovers with ATR-based stop-loss (SL) and take-profit (TP) markers, this indicator provides a complete entry and risk management framework in a single script.
Unique Features:
1. Versatile Moving Average Combinations: The indicator allows users to select from four types of moving averages—SMA, EMA, DEMA, and TEMA—for both fast and slow lines, enabling a variety of crossover configurations. This flexibility helps traders tailor entry signals to specific trading strategies, asset types, or market conditions, enhancing the adaptability of the indicator across different styles and preferences.
2. ATR-Based Dynamic Risk Management: Leveraging the Average True Range (ATR), the indicator dynamically calculates stop-loss and take-profit levels based on market volatility. This approach adjusts to changing market conditions, making it more responsive and reliable for setting realistic, volatility-based risk parameters.
3. Customizable Risk/Reward Ratio: Users can define their preferred risk/reward ratio (e.g., 2:1, 3:1) to tailor take-profit levels relative to stop-loss distances. This feature empowers traders to align trades with their individual risk management strategies and objectives, while maintaining consistency and discipline in execution.
4. Streamlined Visualization of Entry and Risk Levels: Upon a crossover, the indicator places discrete markers at the calculated SL and TP levels, avoiding clutter while providing traders with an immediate view of potential risk and reward. Small dots represent SL and TP levels, offering a clean, clear display of critical decision points.
How to Use:
1. Entry Signals from MA Crossovers: This indicator generates entry signals when the selected moving averages cross, with green markers indicating long entries and red markers indicating short entries. The customizable MA selection enables traders to optimize crossover signals for various timeframes and asset classes.
2. Integrated Risk Markers: SL and TP levels are shown as small dots at the crossover point, based on the ATR multiplier and risk/reward ratio settings. These markers allow traders to quickly visualize the defined risk and potential reward for each entry.
This indicator offers a comprehensive solution for trend-following strategies by combining entry signals with adaptive risk management. Suitable for multiple timeframes, it allows for backtesting and adjustments to ATR and risk/reward parameters for improved alignment with individual trading goals. As with all strategies, thorough testing is recommended to ensure compatibility with your trading approach.

Chandelier Exit Pro w/ExtensionsChandelier Exit Pro w/Extensions
The Chandelier Exit Pro w/Extensions indicator is designed to assist traders in managing risk and identifying trend reversals. The strategy is based on the Chandelier Exit concept, originally created by Charles Le Beau. It uses the Average True Range (ATR) to calculate dynamic stop levels that adjust based on market volatility. This script not only implements the standard Chandelier Exit, but also introduces extension levels and alerts to enhance decision-making.
Key Features:
➡️Dynamic Stop Levels: The indicator calculates stop levels for both long and short positions based on an ATR multiple. This allows traders to determine exit points by monitoring when the price crosses above or below these levels. These levels adapt in real-time based on price volatility, making them a versatile tool for trend-following strategies.
➡️Extension Levels: In addition to the primary stop levels, the script includes extension levels for more advanced stop-loss management. Traders can view active and extension levels separately, providing more flexibility in their exit strategies.
➡️Labels and Visual Cues: The indicator provides dynamic labels that automatically update and follow the plotted stop levels. Labels include the ATR multiplier value (e.g., "2.5" or "2.5ext"), clearly showing the significance of each level. When price crosses below or above a level, the corresponding label is highlighted, aiding traders in quickly identifying the most relevant stop level.
➡️Bar Confirmation and Alerts: The script includes an "await bar confirmation" option to ensure that the stop levels and alerts only trigger after the bar has closed. Alerts are customizable and will notify traders when price crosses critical levels, helping to make timely decisions without the need to constantly monitor charts.
➡️Multiple ATR Levels for Enhanced Precision: The indicator supports up to four different ATR levels, each with customizable multipliers. This allows traders to set different thresholds for exits based on varying degrees of volatility. For example, Level 1 (2.5x ATR) might represent a tighter stop, while Level 4 (10x ATR) could serve as a wider stop for long-term positions.
➡️Calc_bars_count: Improves efficiency of the indicator by reducing the on-chart calculations in to the past. This input can be found at the bottom of the INPUTS tab.
How it Helps Traders:
💥Trend Identification: By using the Chandelier Exit levels, traders can identify when the trend is likely to reverse. When the price crosses below the stop level in a long trade or above the stop level in a short trade, it signals a potential exit point.
💥Volatility-based Adjustments: Unlike static stop-loss methods, the ATR-based stop levels dynamically adjust based on the market’s volatility. This means tighter stops during low volatility periods and wider stops during high volatility periods, reducing the chance of being stopped out prematurely.
💥Risk Management: The dynamic stop levels and extension levels provide a structured way to manage risk. Traders can set tighter stops for short-term trades and wider stops for longer-term trades. The script's visual labels make it easy to track these levels in real-time.
💥Automation with Alerts: The built-in alert system ensures that traders are notified when key levels are crossed. This helps to avoid emotional decision-making and allows for better execution of trading strategies.
Confluence and Price Fluidity:
One of the powerful ways to enhance the effectiveness of the Chandelier Exit indicator is by using it in conjunction with other technical analysis tools to create confluence. Confluence occurs when multiple indicators or price action signals align, providing stronger confirmation for a trade decision. For example:
🎯Support and Resistance Levels: Traders can use the Chandelier Exit levels in combination with key support and resistance zones. If the price is nearing a support level and the Chandelier Exit signals a bullish reversal, this alignment strengthens the case for entering a long position.
🎯Moving Averages: When the Chandelier Exit signals a trend reversal and this is confirmed by a crossover in moving averages (such as a 50-day and 200-day moving average), traders gain additional confidence in the trade direction.
🎯Momentum Indicators: Traders can also look for momentum indicators like RSI or MACD to confirm the strength of a trend or potential reversal. For instance, if the Chandelier Exit triggers a short signal and the RSI also shows overbought conditions, this could provide stronger confirmation to exit a long trade or enter a short position.
🎯Candlestick Patterns: Price fluidity can be monitored using candlestick formations. For example, a bearish engulfing pattern near a Chandelier Exit resistance level offers confluence, adding confidence to the signal to close or short the trade.
By combining the Chandelier Exit with other tools, traders ensure that they are not relying on a single indicator. This layered approach can reduce the likelihood of false signals and improve overall trading accuracy.
Practical Use Case:
Imagine a trader enters a long position, and the price moves favorably. Using the Chandelier Exit, the trader sets the initial stop level at 2.5x ATR below the highest close. As the price continues to rise, the stop level follows the price, locking in profits. If the market suddenly turns, the price crossing below the stop level signals an exit, helping the trader preserve gains. With extension levels, the trader can further refine exits, adjusting based on their risk tolerance and market conditions.
Good luck and I hope that you can find a place in your tool bag to use this dynamic indicator 🙏

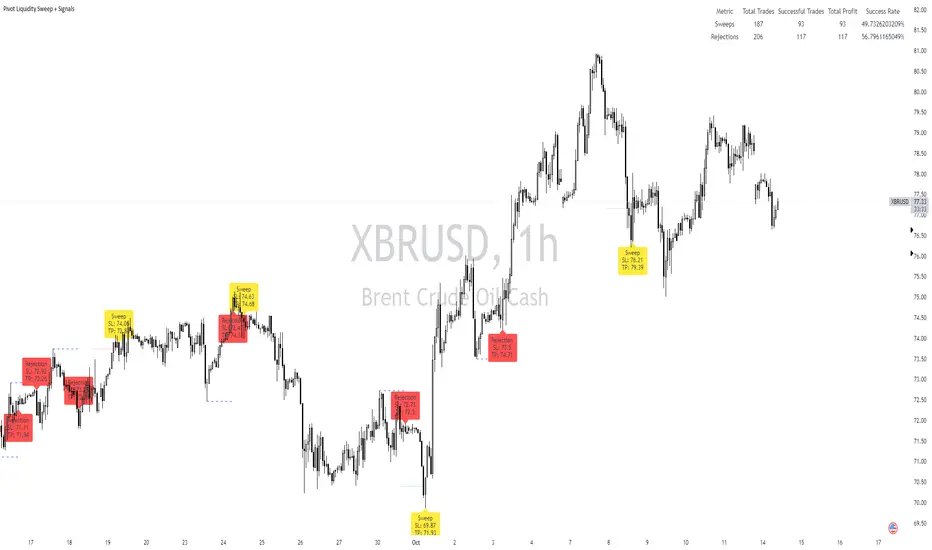
Pivot Liquidity Sweep + SignalsCore Functionalities:
Sweep Signals:
The indicator identifies sweeps of liquidity by detecting when price exceeds recent pivot highs (swing highs) or pivot lows (swing lows) and then reverses direction. It draws attention to these scenarios by labeling them on the chart.
For bullish sweep signals, the entry point is the closing price of the sweep candle, with the stop loss placed at the highest point between the sweep candle and the previous candle.
For bearish sweeps, the entry point is similarly identified, with the stop loss being the lowest price of the sweep candle and the candle before it. The profit target is dynamically set to the low or high of the closest valid pivot depending on the direction of the trade.
Rejection Signals:
Rejection signals are identified when price attempts to break a pivot high or low but fails, causing a rejection.
Bullish rejections involve price trying to break a pivot low but closing back above it, indicating potential for a bounce.
Bearish rejections follow a similar pattern, with price attempting to break a pivot high but failing to hold above it, signaling a potential bearish move.
High-Precision Intrabar Data:
The "Intrabar Precision" feature allows the indicator to use lower timeframe data to accurately plot sweeps and rejections, providing traders with precise entry and exit points.
The intrabar settings are particularly useful for traders looking for high-precision trades, such as scalpers who want to capture small yet consistent moves.
ATR and Percentage-Based Filters:
The indicator allows for customizable filters to ensure signals meet certain thresholds before being validated. Traders can use ATR (Average True Range) or percentage-based conditions to filter out low-quality signals, ensuring that the trades captured have enough volatility or price movement potential.
Dashboard:
The built-in dashboard provides a quick overview of trades executed using the indicator, displaying metrics such as the total number of sweep and rejection trades, their success rates, and total profit in points.
The dashboard is color-coded for easy reading and offers traders insights into the overall performance of their strategy, helping with ongoing evaluation and optimization.
Labeling and Alerts:
Every time a sweep or rejection signal is detected, the indicator automatically labels the chart to help traders quickly identify the trading opportunities.
Alerts are also generated for each trading signal, providing the trader with real-time notifications, which can be useful for those who are not constantly monitoring their charts.
Stop Loss and Target Adaptation:
The stop loss levels are adjusted dynamically based on the recent pivot points, and the target profit is derived from valid subsequent pivot levels to ensure realistic and efficient trade exits.
Breakout LevelsBreakout Levels Indicator
The Breakout Levels indicator is a tool designed to help traders identify potential breakout points based on a specified time range and market volatility. By combining user-defined time frames with Average True Range (ATR) calculations, it provides actionable entry and stop-loss levels for both upward and downward breakouts. Additionally, it includes risk management features to calculate appropriate position sizes based on your account capital and risk tolerance.
Key Features
Custom Time Range Selection: Define a specific period during which the indicator calculates the highest high and lowest low to establish breakout levels.
ATR-Based Calculations: Use the ATR to adjust entry and stop-loss levels according to market volatility.
Risk Management: Automatically calculate position sizes based on your account capital and desired risk per trade.
Indicator Inputs
Start Time : The beginning of the time range for calculating the highest high and lowest low.
End Time : The end of the time range.
Entry Multiplier: A factor that determines how far the entry level is from the breakout level, scaled by the ATR.
Stop-Loss Multiplier: A factor that determines the distance of the stop-loss from the entry level, scaled by the ATR.
Risk per Trade (%) : The percentage of your account capital you're willing to risk on each trade.
Account Capital : Your total trading capital used for position size calculations.
ATR Length : The number of periods over which the ATR is calculated.
Position Size Up / Down : Shows you Lot size to maintain no loss more than allowed percentage at that entry

Bull Trade Zone IndicatorThe BULL TRADE ZONE INDICATOR is a powerful trading tool designed to help traders identify optimal entry and exit points in the market. This script uses a combination of two Exponential Moving Averages (EMA) and the Average True Range (ATR) to generate buy and sell signals, making it ideal for traders looking to enhance their trading strategy with precise and timely alerts.
Key Features:
Dynamic Buy and Sell Signals: The indicator generates buy signals when the 14 EMA crosses above the 150 EMA and the price is trading above the 150 EMA. Sell signals are generated when the 14 EMA crosses below the 150 EMA and the price is below the 150 EMA, providing clear guidance on potential market trends.
Built-In Stop-Loss Levels: Automatic stop-loss levels are calculated based on the ATR, helping traders manage risk effectively by setting realistic stop-loss points based on market volatility.
Minimal Chart Clutter: To maintain a clean and focused trading environment, the 14 EMA and 150 EMA values are privately used within the script without being visibly plotted on the chart, ensuring that the focus remains on actionable signals.
Clear Visual Alerts: Buy and sell signals are highlighted directly on the chart with intuitive labels, making it easy to spot trading opportunities at a glance.
Who Is This For?
This indicator is suitable for traders of all levels—whether you are a beginner looking for a straightforward trading tool or an experienced trader seeking to add an additional layer of confirmation to your strategy. The BULL TRADE ZONE INDICATOR helps you stay ahead of the market by precisely identifying key trading zones.
How to Use:
Add the indicator to your chart.
Monitor the buy and sell signals generated by the script.
Use the plotted stop-loss levels to manage your trades effectively.
Customize your trading strategy using the indicator’s signals to align with your risk appetite and market view.
Disclaimer:
This indicator is a technical analysis tool designed to assist with decision-making. It should be used alongside other analyses and strategies, not as the sole basis for trading decisions. Always perform your due diligence and risk management when trading.

Risk TrackerThis Risk Tracker Pine Script provides traders with a customizable tool for tracking and managing trade risk directly on their chart. The script is designed to accommodate both futures and crypto trades, allowing you to monitor risk and reward parameters, adjust contract sizes, and manage leverage in real-time.
Key Features:
1. Trade Direction and Risk-Reward Ratio:
• Select between Long or Short trade directions.
• Set a custom Risk-Reward Ratio (RRR) to calculate potential profit and loss levels based on your trade setup.
2. Customizable Parameters:
• Input fields for contract size, leverage, margin, and maximum drawdown allow you to adjust the risk settings depending on the market you are trading.
• You can toggle between using a dollar-based or percentage-based risk calculation depending on whether you’re trading futures (USD-based) or crypto.
3. Real-time Stop-Loss and Take-Profit Calculation:
• The script automatically calculates and draws the Stop-Loss (SL) and Take-Profit (TP) levels on the chart based on your entry price and selected risk settings.
• The color of the SL and TP lines is customizable, allowing you to visually distinguish profit and loss levels.
4. Historical Price Levels:
• If there is no active trade, the script scans historical price data to find the last instances when the price hit the predefined stop-loss or take-profit levels, helping you understand past price behavior.
5. Risk Management Table:
• A summary table is displayed on the chart, showing the key metrics of your trade, including:
• Tick value and Dollar value for futures.
• Margin and Leverage for crypto.
• Risk-Reward Ratio, Entry price, Risk and Profit in USD or percentage terms.
• The table dynamically updates based on the current trade status.
6. Extended Chart Visualization:
• Option to extend the SL and TP lines to the left of the chart, allowing you to easily view these levels across multiple timeframes and bars.
This script helps ensure you are always aware of your trade’s risk profile, providing a clear and visual representation of potential profit and loss, both in terms of percentage and dollar value. Ideal for futures and crypto traders who rely on precise risk management to maintain profitability.

Deep Crab Harmonic Pattern [TradingFinder] Reversal Zones🔵 Introduction
The Deep Crab pattern is a 5-point extension harmonic structure (X-A-B-C-D) used in technical analysis to identify potential reversal points in financial markets. Like the original Crab pattern, it heavily relies on a 1.618 XA projection to form the Potential Reversal Zone (PRZ).
However, the key difference lies in the B point, which must be an 0.886 retracement of the XA leg. The D point in this pattern typically extends beyond the X point, signaling a strong potential reversal in price movement.
Bullish Deep Crab :
The Bullish Deep Crab is a pattern used in technical analysis to spot potential trend reversals. It signals a shift from a downtrend to an uptrend. Traders enter a buy position at the D point and set a stop-loss below point X, anticipating a price increase.
Bearish Deep Crab :
The Bearish Deep Crab is a reversal pattern that indicates the potential end of an uptrend. Traders enter a sell position at point D and set a stop-loss above point X, expecting the price to fall afterward.
🟣 Crab Vs Deep Crab
The Crab and Deep Crab patterns are both used to identify reversal points in technical analysis, but they differ in terms of correction depth :
Crab : The B point retraces between 38.2% to 61.8% of the XA leg, and point D extends beyond X, indicating a price reversal after a smaller correction.
Deep Crab : The B point retraces more deeply, around 88.6% of the XA leg, and point D has a stronger extension, signaling a reversal after a deeper correction.
The Deep Crab is more suited for identifying stronger price movements.
🔵 How to Use
To effectively use the Deep Crab pattern, it’s essential to correctly identify its five key points (X, A, B, C, and D) based on Fibonacci retracements and extensions. Traders look for a deep retracement at point B, followed by an extended move to point D, which typically signals a strong price reversal.
Once these points are established, traders can strategically enter positions at point D with appropriate stop-loss and take-profit levels, capitalizing on the anticipated market reversal. Proper use of Fibonacci tools is crucial for accurate pattern identification.
🟣 Bullish Deep Crab
To use the Bullish Deep Crab pattern, a trader identifies point D as the key price reversal point in a downtrend. Using Fibonacci tools, points X, A, B, and C are identified, with point B showing an 88.6% retracement of XA, and CD extending 1.618% of XA.
The trader enters a buy position at point D and sets a stop-loss below X, expecting a reversal from a downtrend to an uptrend.
🟣 Bearish Deep Crab
In the Bearish Deep Crab pattern, point D acts as the reversal point in an uptrend. After identifying points X, A, B, and C, D extends 1.618% of XA. Point B retraces 88.6% of XA. Traders enter a sell position at point D and place a stop-loss above X, anticipating a drop in price.
🔵 Setting
🟣 Logical Setting
ZigZag Pivot Period : You can adjust the period so that the harmonic patterns are adjusted according to the pivot period you want. This factor is the most important parameter in pattern recognition.
Show Valid Forma t: If this parameter is on "On" mode, only patterns will be displayed that they have exact format and no noise can be seen in them. If "Off" is, the patterns displayed that maybe are noisy and do not exactly correspond to the original pattern.
Show Formation Last Pivot Confirm : if Turned on, you can see this ability of patterns when their last pivot is formed. If this feature is off, it will see the patterns as soon as they are formed. The advantage of this option being clear is less formation of fielded patterns, and it is accompanied by the latest pattern seeing and a sharp reduction in reward to risk.
Period of Formation Last Pivot : Using this parameter you can determine that the last pivot is based on Pivot period.
🟣 Genaral Setting
Show : Enter "On" to display the template and "Off" to not display the template.
Color : Enter the desired color to draw the pattern in this parameter.
LineWidth : You can enter the number 1 or numbers higher than one to adjust the thickness of the drawing lines. This number must be an integer and increases with increasing thickness.
LabelSize : You can adjust the size of the labels by using the "size.auto", "size.tiny", "size.smal", "size.normal", "size.large" or "size.huge" entries.
🟣 Alert Setting
Alert : On / Off
Message Frequency : This string parameter defines the announcement frequency. Choices include: "All" (activates the alert every time the function is called), "Once Per Bar" (activates the alert only on the first call within the bar), and "Once Per Bar Close" (the alert is activated only by a call at the last script execution of the real-time bar upon closing). The default setting is "Once per Bar".
Show Alert Time by Time Zone : The date, hour, and minute you receive in alert messages can be based on any time zone you choose. For example, if you want New York time, you should enter "UTC-4". This input is set to the time zone "UTC" by default.
🔵 Conclusion
The Deep Crab pattern is a valuable reversal tool in technical analysis, known for its deep retracement and extended price movements.
Unlike other harmonic patterns, it emphasizes identifying critical points where price action is likely to reverse sharply. This pattern works well in both bullish and bearish market scenarios, offering clear signals for entry and exit points.
However, successful application requires a deep understanding of market behavior and precise use of technical tools like Fibonacci retracement. Overall, mastering this pattern can enhance trading strategies and risk management.

Uptrick: Imbalance MA Trailing System
### **Overview**
The "Uptrick: Imbalance MA Trailing System" is a complex trading indicator designed to help traders identify potential bullish and bearish imbalances in the market, coupled with a trailing stop mechanism to manage trades. The indicator uses a combination of moving averages, Average True Range (ATR), and custom logic to detect trading signals and plot various levels on the chart to assist traders in making informed decisions.
### **Key Components and Functionality**
#### 1. **Inputs and Configuration**
- **Imbalance Filter (`imbalanceFilter`)**: This input sets the filter for detecting imbalances based on the difference between two price points. The value is a float and can be adjusted to fine-tune the sensitivity of imbalance detection. The default value is `0.0`, with a step size of `0.1`.
- **Moving Average Settings (`maLength1`, `maLength2`, `maColor1`, `maColor2`)**:
- `maLength1` and `maLength2` define the lengths of the two moving averages used in the indicator. By default, they are set to `50` and `200` periods, respectively.
- `maColor1` and `maColor2` specify the colors of these moving averages on the chart. The first MA is colored blue, and the second is red.
- **Take Profit and Stop Loss Settings (`displayTP`, `tpMultiplier`, `tpColor`, `displaySL`, `slMultiplier`, `slColor`)**:
- `displayTP` and `displaySL` are boolean inputs that control whether the TP and SL areas are displayed on the chart.
- `tpMultiplier` and `slMultiplier` are multipliers used to calculate the TP and SL levels relative to the detected imbalance level using the ATR value.
- `tpColor` and `slColor` define the colors of these areas. The TP area is green (with a transparency of 50), and the SL area is red (with a transparency of 50).
- **Trailing Stop Settings (`trailMultiplier`)**: This setting determines the multiplier used to calculate the trailing stop level based on the ATR value. The default multiplier is `2.5`.
- **Style Settings (`bullishColor`, `bearishColor`)**:
- `bullishColor` and `bearishColor` set the colors for bullish and bearish zones created when an imbalance is detected. The bullish zone is green, and the bearish zone is red.
- **Signal Label Size (`labelSizeOption`)**: The size of the signal labels displayed on the chart can be adjusted. The options include `Tiny`, `Small`, `Normal`, `Large`, and `Huge`. The selected size affects the visual prominence of the labels.
#### 2. **ATR Calculation (`atrValue`)**
- The ATR value is calculated using a period of 14, which is a standard setting for measuring market volatility. This value is used extensively throughout the indicator to calculate TP, SL, and trailing stop levels.
#### 3. **Imbalance Detection and Zone Creation**
- The indicator detects potential imbalances in the market by comparing certain price points, using a custom function (`imbalanceCondition`).
- **Bullish Imbalance Detection (`bullishSignal`)**:
- A bullish imbalance is detected when the low of three bars ago is higher than the high of one bar ago, and the current close is above the low of three bars ago.
- Additional conditions include checking that the current close is above the calculated average of the two moving averages (`ma1` and `ma2`), and that the imbalance exceeds the threshold set by the `imbalanceFilter`.
- **Bearish Imbalance Detection (`bearishSignal`)**:
- A bearish imbalance is detected under conditions where the low of one bar ago is higher than the high of three bars ago, and the current close is below the high of three bars ago.
- Like the bullish signal, the close must also be below the average of the two moving averages, and the imbalance must exceed the `imbalanceFilter` threshold.
- Upon detection of an imbalance (either bullish or bearish), the indicator creates a zone using `box.new` that highlights the price range of the imbalance. The box color corresponds to the bullish or bearish nature of the signal.
- The center of the imbalance range is marked with a dashed line, and a corresponding label (`🔴` for bearish and `🟢` for bullish) is placed on the chart to indicate the detected signal.
#### 4. **Take Profit and Stop Loss Calculation (`calculateTPSL`)**
- When an imbalance is detected, the indicator calculates potential TP and SL levels based on the ATR value and the respective multipliers.
- If the TP or SL areas are enabled, the indicator plots these areas as colored boxes on the chart.
- The function also tracks whether these levels are hit by subsequent price action, updating the status (`reached`) as appropriate.
#### 5. **Trailing Stop Logic (`applyTrailingStop`)**
- The trailing stop feature is a dynamic mechanism that adjusts the stop level as the price moves in the trader's favor.
- The trailing stop is calculated using the ATR value multiplied by the `trailMultiplier`.
- If the trailing stop is triggered (i.e., the price crosses the trailing stop level), the indicator marks the trade as stopped out.
#### 6. **Plotting and Visualization**
- The indicator plots the two moving averages on the chart with the specified colors and line width.
- If a trailing stop is active, it plots the trailing stop level on the chart, updating as the stop moves.
- The bar color changes based on the status of the current signal and whether the trailing stop or TP/SL levels have been hit.
### **Detailed Execution Flow**
1. **Initialization**: The indicator initializes several variables, including lines, boxes, and the current signal state. This setup ensures that the script can dynamically update these elements as new price data comes in.
2. **Moving Average Calculation**: The moving averages (`ma1` and `ma2`) are calculated using simple moving average (SMA) functions, which are foundational for many of the indicator's conditions.
3. **Imbalance Detection**: The script evaluates price action to detect potential bullish or bearish imbalances, applying filters based on the user-defined `imbalanceFilter`.
4. **Zone Creation and Labeling**: Upon detecting an imbalance, the script creates visual zones on the chart using the `box.new` function and labels the zones for easy identification.
5. **Take Profit and Stop Loss Logic**: The TP and SL areas are calculated and plotted if the relevant settings are enabled. The script continuously checks if these levels are reached as new bars form.
6. **Trailing Stop Calculation**: The script dynamically adjusts the trailing stop level based on the price movement and ATR value. The trailing stop helps lock in profits as the trade progresses.
7. **Plotting**: The moving averages, trailing stop levels, and bar colors are plotted on the chart, providing a visual representation of the indicator's signals and trade management levels.
8. **Final Checks and Updates**: The script concludes each bar's processing by updating the status of various elements, such as whether levels have been reached or if the trailing stop has been triggered.
### **Conclusion**
The "Uptrick: Imbalance MA Trailing System" is a highly versatile indicator designed for traders who want to identify market imbalances and manage their trades effectively using a combination of moving averages, ATR-based calculations, and custom logic. The indicator offers a wide range of customization options, allowing traders to adjust the sensitivity of imbalance detection, the size of the signal labels, and the visibility of various trade management levels (TP, SL, and trailing stop).
The combination of these features makes it a powerful tool for both novice and experienced traders, providing clear visual cues and robust trade management capabilities directly on the chart.

Position Size CalculatorThe Position Size Calculator (PSC) is a comprehensive tool designed to assist traders in managing their trades risk by accurately calculating the optimal position size based on account settings, trade levels, and risk management parameters. This indicator helps traders make informed decisions by providing critical information about potential profit and loss , risk-reward ratio (RRR) , and position size (PS) .
█ Key Features
• Customizable Account Settings: Define your account size , currency , risk tolerance , and commission structure to personalize the calculations.
• Real-Time Trade Levels: Easily input your entry , stop loss , and take profit prices directly on the chart for immediate calculations.
• Visual Indicators: Clearly see your entry, stop loss, and take profit levels with customizable colors and labels.
• Comprehensive Position Information: View detailed information about your position, including potential profit and loss , risk-reward ratio , and position size .
• Currency Conversion: Automatically convert prices to your account currency, making it easy to manage trades in different markets.
• Hide Metrics : Choose which metrics to display to avoid emotional influence on your trading decisions (e.g., hiding PnL).
█ Conclusion
The Position Size Calculator is an essential tool for traders looking to optimize their trading strategies and manage risk effectively . By providing detailed calculations and visual indicators, this tool helps you make informed decisions, improving your overall trading performance.
█ Important
• Ensure that your stop loss and take profit levels are correctly set relative to your entry price to avoid errors.
• The default commission setting considers both entry and exit commissions. Adjust accordingly if only one commission is applicable.
Consider using this tool to manage every trade risk correctly and prevent significant drawdowns.
Hope you like it. Happy trading!

ICT KillZones + Pivot Points [TradingFinder] Support/Resistance 🟣 Introduction
Pivot Points are critical levels on a price chart where trading activity is notably high. These points are derived from the prior day's price data and serve as key reference markers for traders' decision-making processes.
Types of Pivot Points :
Floor
Woodie
Camarilla
Fibonacci
🔵 Floor Pivot Points
Widely utilized in technical analysis, floor pivot points are essential in identifying support and resistance levels. The central pivot point (PP) acts as the primary level, suggesting the trend's likely direction.
The additional resistance levels (R1, R2, R3) and support levels (S1, S2, S3) offer further insight into potential trend reversals or continuations.
🔵 Camarilla Pivot Points
Featuring eight distinct levels, Camarilla pivot points closely correspond with support and resistance, making them highly effective for setting stop-loss orders and profit targets.
🔵 Woodie Pivot Points
Similar to floor pivot points, Woodie pivot points differ by placing greater emphasis on the closing price, often resulting in different pivot levels compared to the floor method.
🔵 Fibonacci Pivot Points
Fibonacci pivot points combine the standard floor pivot points with Fibonacci retracement levels applied to the previous trading period's range. Common retracement levels used are 38.2%, 61.8%, and 100%.
🟣 Sessions
Financial markets are divided into specific time segments, known as sessions, each with unique characteristics and activity levels. These sessions are active at different times throughout the day.
The primary sessions in financial markets include :
Asian Session
European Session
New York Session
The timing of these major sessions in UTC is as follows :
Asian Session: 23:00 to 06:00
European Session: 07:00 to 14:25
New York Session: 14:30 to 22:55
🟣 Kill Zones
Kill zones are periods within a session marked by heightened trading activity. During these times, trading volume surges and price movements become more pronounced.
The timing of the major kill zones in UTC is :
Asian Kill Zone: 23:00 to 03:55
European Kill Zone: 07:00 to 09:55
New York Kill Zone: 14:30 to 16:55
Combining kill zones and pivot points in financial market analysis provides several advantages :
Enhanced Market Sentiment Analysis : Aligns key price levels with high-activity periods for a clearer market sentiment.
Improved Timing for Trade Entries and Exits : Helps better time trades based on when price movements are most likely.
Higher Probability of Successful Trades : Increases the accuracy of predicting market movements and placing profitable trades.
Strategic Stop-Loss and Profit Target Placement : Allows for precise risk management by strategically setting stop-loss and profit targets.
Versatility Across Different Time Frames : Effective in both short and long time frames, suitable for various trading strategies.
Enhanced Trend Identification and Confirmation : Confirms trends using both pivot levels and high-activity periods, ensuring stronger trend validation.
In essence, this integrated approach enhances decision-making, optimizes trading performance, and improves risk management.
🟣 How to Use
🔵 Two Approaches to Trading Pivot Points
There are two main strategies for trading pivot points: utilizing "pivot point breakouts" and "price reversals."
🔵 Pivot Point Breakout
When the price breaks through pivot lines, it signals a shift in market sentiment to the trader. In the case of an upward breakout, where the price crosses these pivot lines, a trader might enter a long position, placing their stop-loss just below the pivot point (P).
Conversely, if the price breaks downward, a short position can be initiated below the pivot point. When using the pivot point breakout strategy, the first and second support levels can serve as profit targets in an upward trend. In a downward trend, these roles are filled by the first and second resistance levels.
🔵 Price Reversal
An alternative method involves waiting for the price to reverse at the support and resistance levels. To implement this strategy, traders should take positions opposite to the prevailing trend as the price rebounds from the pivot point.
While this tool is commonly used in higher time frames, it tends to produce better results in shorter time frames, such as 1-hour, 30-minute, and 15-minute intervals.
Three Strategies for Trading the Kill Zone
There are three principal strategies for trading within the kill zone :
Kill Zone Hunt
Breakout and Pullback to Kill Zone
Trading in the Trend of the Kill Zone
🔵 Kill Zone Hunt
This strategy involves waiting until the kill zone concludes and its high and low lines are established. If the price reaches one of these lines within the same session and is strongly rejected, a trade can be executed.
🔵 Breakout and Pullback to Kill Zone
In this approach, once the kill zone ends and its high and low lines stabilize, a trade can be made if the price breaks one of these lines decisively within the same session and then pulls back to that level.
🔵 Trading in the Trend of the Kill Zone
Kill zones are characterized by high trading volumes and strong trends. Therefore, trades can be placed in the direction of the prevailing trend. For instance, if an upward trend dominates this area, a buy trade can be entered when the price reaches a demand order block.

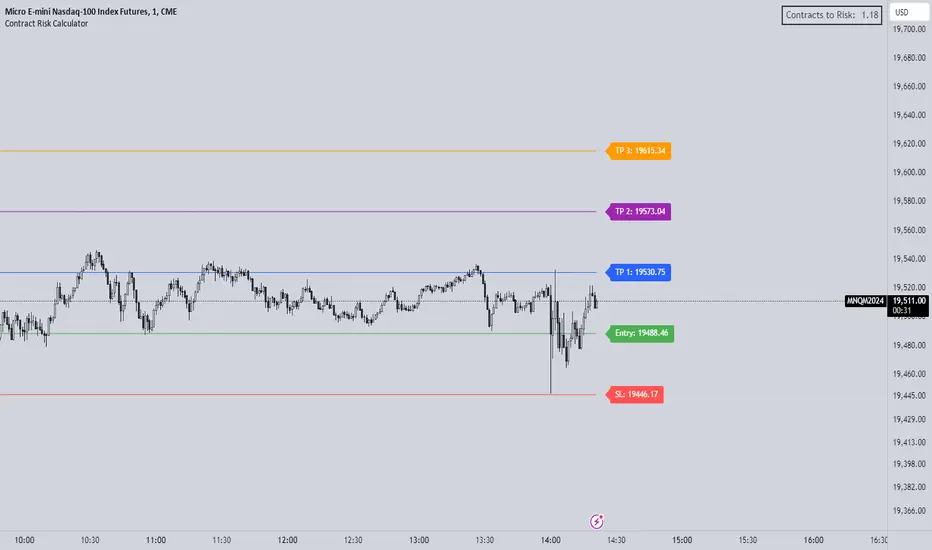
Futures Risk CalculatorThe "Futures Risk Calculator" is designed to assist traders in calculating the number of contracts to risk based on their account size, risk percentage, and stop loss level. This script provides a convenient way for traders to determine their position size in futures or other instruments where contracts are used.
The script prompts users to input their account size, risk percentage, entry price, and stop loss price. It then calculates the stop size in points, risk in dollars, and the number of contracts to risk. These calculations are based on standard risk management principles commonly used in trading.
The script plots the entry and stop loss lines on the chart for visual reference. Additionally, it displays a label in the top-right corner of the chart, showing the calculated number of contracts to risk. The label updates dynamically as the input values or market conditions change.
Originality and Usefulness:
This script is original and adds value to the TradingView community by providing traders with a practical tool for managing risk in their trading strategies. It is focusing on risk management, an essential aspect of successful trading.
By automating the calculation process, the script saves traders time and reduces the potential for manual errors. It encourages traders to adopt disciplined risk management practices, which are crucial for long-term profitability and capital preservation.
How to Use:
Input your account size, risk percentage, entry price, and stop loss price in the script settings.
Enter the pip size according to the instrument you are using (by default its's based for NASDAQ)
The script will automatically calculate the number of contracts to risk based on the provided inputs.
The entry and stop loss lines will be plotted on the chart for visual reference.
The calculated number of contracts to risk will be displayed in the top-right corner of the chart.
By following these steps, traders can effectively manage their risk exposure and make informed decisions when entering trades.
Evolving RThe "Evolving R" script is a script that allows to calculate a dynamic reward-to-risk ratio at any given point of time during the trade. Its fundamentals are based on Tom Dante's concept of an evolving reward-to-risk. The script requires a user to input their preferred stop loss price and the target price for a specific asset, and calculates the ratio between two differences: (a) the absolute difference between the target price and the current price and (b) the absolute difference between the stop loss price and the current price.
The output of the script displays the ratio discussed as a value called "Evolving R" in the table. In order to use it successfully, the user of the script has to input:
(a) Stop loss price for the asset
(b) Target price for the asset
Theoretically, as long as the evolving R value holds above or equal to 0.25, the trade is worth holding. However, if the evolving R value drops below 0.25, the table turns red and signifies that such a trade possesses more risk than there is a reward remaining: this alerts the user to possibly take profits prematurely without risking their unrealized gains for a minor amount of additional gain.
The graphics of the script are represented by green and red areas: the green area indicates the area between the current price and the target price, while the red area shows the distance between the current price and the stop loss price. This visual representation allows users to understand the relative reward-to-risk ratio graphically in addition to the given evolving R value output.
The script is used for any type of trading: whether trend-trading or in a ranging market, it doesn't suggest a user which market conditions they should use.

ICT Unicorn Model [LuxAlgo]The ICT Unicorn Model indicator highlights the presence of "unicorn" patterns on the user's chart which is derived from the lectures of "The Inner Circle Trader" (ICT) .
Detected patterns are followed by targets with a distance controlled by the user.
🔶 USAGE
At its core, the ICT Unicorn Model relies on two popular concepts, Fair Value Gaps and Breaker Blocks. This combination highlights a future area of support/resistance.
A Bullish Unicorn Pattern consists out of:
A Lower Low (LL), followed by a Higher High (HH)
A Fair Value Gap (FVG), overlapping the established Breaker Block
A successful re-test of the FVG which confirms the pattern.
A Bearish Unicorn Pattern consists of:
A Higher High (HH), followed by a Lower Low (LL)
A Fair Value Gap (FVG), overlapping the established Breaker Block
A successful re-test of the FVG which confirms the pattern
The pattern detection depends on detected swings, which can be controlled by the Swing setting. Using higher values of this setting will return longer-term breaker blocks.
🔹 Using Risk/Reward Targets
A confirmed Unicorn pattern will show a blue ( Target ) / grey ( Stop Loss) "Risk/Reward" areas (RR).
When the Stop Loss or Target is hit, a white line is shown on the concerned side.
The Risk/Reward ratio can be adjusted in the "Targets" settings.
🔹 Trailing Stop
As seen in the previous snapshots, besides the RR areas, this indicator also includes an optional Trailing Stop .
This can be helpful to lower your risk, by exiting earlier than if you would wait until the Stop Loss is hit.
This example shows a successful bullish and bearish Unicorn Pattern . In this scenario, the Trailing Stop could be used for partial Take Profit.
The goal of this publication is to show confirmed Unicorn Patterns . To increase the chance of success, it is important to evaluate the bigger picture & use this in confluence with your price action analysis. For example, look for potential areas of liquidity, consider this pattern only during certain market sessions, avoid trading during heavy impact news, &/or incorporate other aspects of technical analysis rather than just following this pattern blindly.
🔶 DETAILS
🔹 Combine
When disabled, all potential Unicorn Patterns will delete previous unconfirmed patterns:
Enabling Combine ensures the last Unicorn Patterns in the opposite direction will remain.
While the latter bullish pattern became invalid, another one formed.
The combination of the previous bearish pattern, and looking at the big picture, the bullish pattern did not have much chance to be successful.
While disabling 'combine' helps minimize clutter, enabling this feature can give a pattern more chance to hit the SL/Target level.
🔹 Mitigated FVG
Users can determine if a pattern becomes invalid due to a mitigated FVG, causing the pattern to be deleted.
🔹 New pattern detected
When a new pattern is detected, the previous unconfirmed pattern in the same direction (bullish - bullish or bearish - bearish) will be deleted. This will always be the case, whether "Combine' is enabled or disabled.
When the previous pattern was confirmed but no SL or Target level was hit, this pattern will stop updating.
🔶 SETTINGS
🔹 Unicorn
Swings: This sets the length of swings, used for the underlying ZigZag and Unicorn Patterns detection.
Bull: Enable/disable Bullish patterns, and set the color of FVG box and Trailing Stop .
Bear: Enable/disable Bearish patterns, and set the color of FVG box and Trailing Stop .
Combine: When enabled, patterns in opposite directions (bullish/bearish) can exist at the same time. disabling this feature tends to give less clutter. See the "Usage" section for more information.
🔹 Targets
Risk/Reward: Sets the Risk/Reward ratio.
Trailing Stop: Set the length of small swings, which is used for the Trailing Stop .

[imba]lance algo🟩 INTRODUCTION
Hello, everyone!
Please take the time to review this description and source code to utilize this script to its fullest potential.
🟩 CONCEPTS
This is a trend indicator. The trend is the 0.5 fibonacci level for a certain period of time.
A trend change occurs when at least one candle closes above the level of 0.236 (for long) or below 0.786 (for short). Also it has massive amout of settings and features more about this below.
With good settings, the indicator works great on any market and any time frame!
A distinctive feature of this indicator is its backtest panel. With which you can dynamically view the results of setting up a strategy such as profit, what the deposit size is, etc.
Please note that the profit is indicated as a percentage of the initial deposit. It is also worth considering that all profit calculations are based on the risk % setting.
🟩 FEATURES
First, I want to show you what you see on the chart. And I’ll show you everything closer and in more detail.
1. Position
2. Statistic panel
3. Backtest panel
Indicator settings:
Let's go in order:
1. Strategies
This setting is responsible for loading saved strategies. There are only two preset settings, MANUAL and UNIVERSAL. If you choose any strategy other than MANUAL, then changing the settings for take profits, stop loss, sensitivity will not bring any results.
You can also save your customized strategies, this is discussed in a separate paragraph “🟩HOW TO SAVE A STRATEGY”
2. Sensitive
Responsible for the time period in bars to create Fibonacci levels
3. Start calculating date
This is the time to start backtesting strategies
4. Position group
Show checkbox - is responsible for displaying positions
Fill checkbox - is responsible for filling positions with background
Risk % - is responsible for what percentage of the deposit you are willing to lose if there is a stop loss
BE target - here you can choose when you reach which take profit you need to move your stop loss to breakeven
Initial deposit- starting deposit for profit calculation
5. Stoploss group
Fixed stoploss % checkbox - If choosed: stoploss will be calculated manually depending on the setting below( formula: entry_price * (1 - stoploss percent)) If NOT choosed: stoploss will be ( formula: fibonacci level(0.786/0.236) * (1 + stoploss percent))
6. Take profit group
This group of settings is responsible for how far from the entry point take profits will be and what % of the position to fix
7. RSI
Responsible for configuring the built-in RSI. Suitable bars will be highlighted with crosses above or below, depending on overbought/oversold
8. Infopanels group
Here I think everything is clear, you can hide or show information panels
9. Developer mode
If enabled, all events that occur will be shown, for example, reaching a take profit or stop loss with detailed information about the unfixed balance of the position
🟩 HOW TO USE
Very simple. All you need is to wait for the trend to change to long or short, you will immediately see a stop loss and four take profits, and you will also see prices. Like in this picture:
🟩 ALERTS
There are 3 types of alerts:
1. Long signal
2. Short signal
3. Any alert() function call - will be send to you json with these fields
{
"side": "LONG",
"entry": "64.454",
"tp1": "65.099",
"tp2": "65.743",
"tp3": "66.388",
"tp4": "67.032",
"winrate": "35.42%",
"strategy": "MANUAL",
"beTargetTrigger": "1",
"stop": "64.44"
}
🟩 HOW TO SAVE A STRATEGY
First, you need to make sure that the “MANUAL” strategy is selected in the strategy settings.
After this, you can start selecting parameters that will show the largest profit in the statistics panel.
I have highlighted what you need to pay attention to when choosing a strategy
Let's assume you have set up a strategy. The main question is how to preserve it?
Let’s say the strategy turned out with the following parameters:
Next we need to find this section of code:
// STRATS
selector(string strategy_name) =>
strategy_settings = Strategy_settings.new()
switch strategy_name
"MANUAL" =>
strategy_settings.sensitivity := 18
strategy_settings.risk_percent := 1
strategy_settings.break_even_target := "1"
strategy_settings.tp1_percent := 1
strategy_settings.tp1_percent_fix := 40
strategy_settings.tp2_percent := 2
strategy_settings.tp2_percent_fix := 30
strategy_settings.tp3_percent := 3
strategy_settings.tp3_percent_fix := 20
strategy_settings.tp4_percent := 4
strategy_settings.tp4_percent_fix := 10
strategy_settings.fixed_stop := false
strategy_settings.sl_percent := 0.0
"UNIVERSAL" =>
strategy_settings.sensitivity := 20
strategy_settings.risk_percent := 1
strategy_settings.break_even_target := "1"
strategy_settings.tp1_percent := 1
strategy_settings.tp1_percent_fix := 40
strategy_settings.tp2_percent := 2
strategy_settings.tp2_percent_fix := 30
strategy_settings.tp3_percent := 3
strategy_settings.tp3_percent_fix := 20
strategy_settings.tp4_percent := 4
strategy_settings.tp4_percent_fix := 10
strategy_settings.fixed_stop := false
strategy_settings.sl_percent := 0.0
// "NEW STRATEGY" =>
// strategy_settings.sensitivity := 20
// strategy_settings.risk_percent := 1
// strategy_settings.break_even_target := "1"
// strategy_settings.tp1_percent := 1
// strategy_settings.tp1_percent_fix := 40
// strategy_settings.tp2_percent := 2
// strategy_settings.tp2_percent_fix := 30
// strategy_settings.tp3_percent := 3
// strategy_settings.tp3_percent_fix := 20
// strategy_settings.tp4_percent := 4
// strategy_settings.tp4_percent_fix := 10
// strategy_settings.fixed_stop := false
// strategy_settings.sl_percent := 0.0
strategy_settings
// STRATS
Let's uncomment on the latest strategy called "NEW STRATEGY" rename it to "SOL 5m" and change the sensitivity:
// STRATS
selector(string strategy_name) =>
strategy_settings = Strategy_settings.new()
switch strategy_name
"MANUAL" =>
strategy_settings.sensitivity := 18
strategy_settings.risk_percent := 1
strategy_settings.break_even_target := "1"
strategy_settings.tp1_percent := 1
strategy_settings.tp1_percent_fix := 40
strategy_settings.tp2_percent := 2
strategy_settings.tp2_percent_fix := 30
strategy_settings.tp3_percent := 3
strategy_settings.tp3_percent_fix := 20
strategy_settings.tp4_percent := 4
strategy_settings.tp4_percent_fix := 10
strategy_settings.fixed_stop := false
strategy_settings.sl_percent := 0.0
"UNIVERSAL" =>
strategy_settings.sensitivity := 20
strategy_settings.risk_percent := 1
strategy_settings.break_even_target := "1"
strategy_settings.tp1_percent := 1
strategy_settings.tp1_percent_fix := 40
strategy_settings.tp2_percent := 2
strategy_settings.tp2_percent_fix := 30
strategy_settings.tp3_percent := 3
strategy_settings.tp3_percent_fix := 20
strategy_settings.tp4_percent := 4
strategy_settings.tp4_percent_fix := 10
strategy_settings.fixed_stop := false
strategy_settings.sl_percent := 0.0
"SOL 5m" =>
strategy_settings.sensitivity := 15
strategy_settings.risk_percent := 1
strategy_settings.break_even_target := "1"
strategy_settings.tp1_percent := 1
strategy_settings.tp1_percent_fix := 40
strategy_settings.tp2_percent := 2
strategy_settings.tp2_percent_fix := 30
strategy_settings.tp3_percent := 3
strategy_settings.tp3_percent_fix := 20
strategy_settings.tp4_percent := 4
strategy_settings.tp4_percent_fix := 10
strategy_settings.fixed_stop := false
strategy_settings.sl_percent := 0.0
strategy_settings
// STRATS
Now let's find this code:
strategy_input = input.string(title = "STRATEGY", options = , defval = "MANUAL", tooltip = "EN:\nTo manually configure the strategy, select MANUAL otherwise, changing the settings won't have any effect\nRU:\nЧтобы настроить стратегию вручную, выберите MANUAL в противном случае изменение настроек не будет иметь никакого эффекта")
And let's add our new strategy there, it turned out like this:
strategy_input = input.string(title = "STRATEGY", options = , defval = "MANUAL", tooltip = "EN:\nTo manually configure the strategy, select MANUAL otherwise, changing the settings won't have any effect\nRU:\nЧтобы настроить стратегию вручную, выберите MANUAL в противном случае изменение настроек не будет иметь никакого эффекта")
That's all. Our new strategy is now saved! It's simple! Now we can select it in the list of strategies:

Anchored Chandelier ExitThe Chandelier Exit is a popular tool among traders used to help determine appropriate stop loss levels. Originally developed by Chuck LeBeau, the Chandelier Exit takes into account market volatility and adjusts the stop loss level dynamically. This indicator builds upon the original Chandelier Exit by allowing the trader to select an anchor date or starting point for the indicator to begin calculating from.
The Original Chandelier Exit
Before we get into the details of the Anchored Chandelier Exit, let's review the original. Essentially a dynamic ATR stop loss, the Chandelier Exit provides a trailing stop that moves higher or lower based on volatility.
The Chandelier Exit is calculated based on the following criteria:
🔶ATR - The ATR is used to measure the volatility of a security over a lookback period. The ATR length determines the number of bars to consider when calculating the average true range. The shorter the length, the more responsive the level will be.
🔶ATR Multiplier - The default multiplier is set to 3. This is used to determine the sensitivity of the Chandelier Exit. The higher the ATR multiplier the wider the stop levels will be. A lower multiplier will tighten stop levels.
🔶Highest / Lowest Points - Determine the highest high (bullish trade) or lowest low (bearish trade) during the lookback period. The default length is 22 bars.
Calculating the Chandelier Exit
Bullish trades - Highest High - ATR * Multiplier
Bearish trades - Lowest Low + ATR * Multiplier
The Anchored Chandelier Exit
The Anchored Chandelier Exit is a new twist on the original, allowing traders to adapt their stop loss levels based on specific market events, levels or bars.
Similar to the original, traders can select the ATR length and multiplier, however, the high or low from which the ATR is subtracted or added is first determined at the anchor bar.
As new bars form, the indicator checks for the previous high/low to be breached. If the high or low is exceeded, the highest/lowest point is updated and the Chandelier Exit is recalculated.
When the indicator is first loaded to your chart, it will ask you to select an anchor bar and choose the bias for the trade.
A bullish (long) bias trade will plot the Chandelier Exit below price action, while a bearish (short) bias trade will plot the Chandelier Exit above price action.
Indicator Features
🔶Custom Start Date
🔶Bullish or Bearish Bias
🔶Selectable ATR Length & Multiplier
🔶Custom Colors
🔶Exit With Close or Wicks
🔶Exit Alerts
With careful parameter optimization, the Anchored Chandelier Exit can be a useful tool for helping traders manage risk based on market volatility.

Ceres Trader Position and Risk Management ToolNOTE: It won't properly scale until you enter an entry point that is located on the chart. It's a feature not a bug. After that, you will see the entry, s/l, and target price lines properly displayed on the chart.
The "Ceres Trader Position and Risk Management Tool" is a comprehensive indicator designed for TradingView, meticulously crafted for traders who prioritize effective risk management and clear position visualization. This tool seamlessly integrates with your trading strategy, providing crucial information about your trades directly on your chart.
Key Features:
Position Type Visualization: Displays long or short positions with distinct color-coded lines and boxes for easy recognition.
Entry, Stop Loss, and Target Levels: Visual markers for entry price, stop loss, and target price, enabling you to track your trade setup at a glance.
Risk Assessment: Calculates and displays the amount at risk based on the stop loss distance and the percentage of risk capital.
Profit Potential: Shows the potential profit in dollar terms if the target is reached, helping you understand the reward prospects of your trade.
Reward to Risk Ratio: Indicates the ratio of potential reward to risk, an essential metric for evaluating the efficiency of your trade setup.
Current P&L Tracking: Continuously updates the open profit and loss based on the current market price, giving you real-time insight into your trade's performance.
Customizable Risk and Reward Boxes: Allows personalization of the risk and reward zones with color options, enhancing chart clarity and visual appeal.
How to Use:
Setting Up Your Trade:
Input your trade details including position type (long or short), entry price, risk capital, risk percentage, reward-risk ratio, and stop loss distance.
Visualize Your Trade:
The tool will automatically plot the entry, stop loss, and target prices on the chart.
Risk and reward areas will be highlighted with customizable color boxes.
Monitor Your Risk and Reward:
View the amount risked and potential profit in dollar terms directly on the chart.
Keep track of the reward to risk ratio to assess trade efficiency.
Stay Informed of Real-time Performance:
The current P&L of your open position will be updated in real-time, helping you make informed decisions.
This tool is ideal for traders who follow disciplined risk management practices and want to keep essential trade information easily accessible. With the "Ceres Trader Position and Risk Management Tool," you are equipped to make strategic trading decisions backed by clear visual cues and critical data.
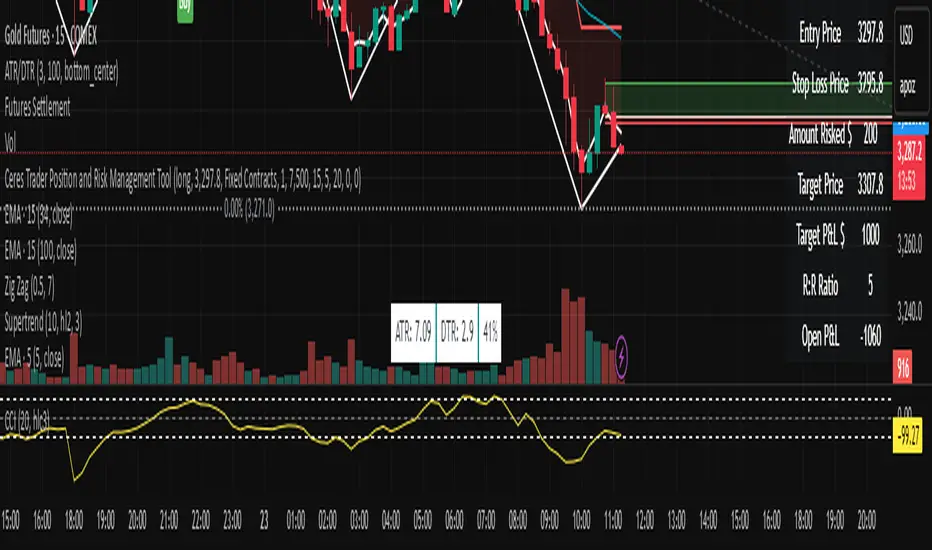
Breakout/Breakdown Indicator (30 Min Range) by InvestYourAsset👉The indicator provided here is a technical analysis indicator for TradingView users that identifies potential breakout and breakdown opportunities on the initial 30-minute range in every trading session.
👉The indicator high and low of the initial 30-minute period and plotting them as horizontal lines on the chart. The high is marked in green line and the low is marked in red line.
📈The indicator then generates buy and sell signals based on whether the current close price crosses above or below the previous 30-minute high and low, respectively.
📢The indicator also has two inputs:
👉 sessionStartHour : The hour at which the trading session begins. The default value is 9, However users can change the time according to their own trading style.
👉 sessionStartMinute : The minute at which the trading session begins. The default value is 0.
These inputs can be used to adjust the indicator to the specific trading session that you are interested in.
✅How to use the Indicator:
👉To use the 30 Minute Breakout/Breakdown Indicator, simply add it to your chart and configure the inputs to your liking. Once the indicator is added to the chart, it will plot the 30-minute high and low as horizontal lines, as well as generate buy and sell signals based on the current close price.
✅Here is a step-by-step guide:
📈Open TradingView and select the chart that you want to add the indicator to.
📈Click on the "Indicators" tab and search for "30 Minute Breakout/Breakdown Indicator by InvestYourAsset".
📈Click on the indicator to add it to your chart.
📈Configure the inputs to your liking. The default values are typically fine, but you can experiment with different values to see what works best for you.
📈Once you are satisfied with the settings, click on the "Apply" button.
📈The indicator will now be displayed on your chart. You will see two horizontal lines representing the previous 30-minute high and low, as well as triangles representing buy and sell signals.
✅How to interpret the signals:
📈Buy signal : A buy signal is generated when the current close price crosses above the previous 30-minute high. This suggests that the price is likely to continue moving higher in the short term.
📈Sell signal : A sell signal is generated when the current close price crosses below the previous 30-minute low. This suggests that the price is likely to continue moving lower in the short term.
👉Traders should remember that the present indicator is just one tool that can be used to identify potential trading opportunities. It is important to use other technical analysis tools and risk management techniques to confirm your trading signals before entering any trades.
✅Things to consider while using the indicator:
📈Look for buy signals in an uptrend and sell signals in a downtrend. This will increase the likelihood of your trades being successful.
📈Place your stop losses below the previous 30-minute low for buy signals and above the previous 30-minute high for sell signals. This will help to limit your losses if the trade goes against you.
📈Consider taking profits at key resistance and support levels. This will help you to lock in your profits and avoid giving them back to the market.
Follow us for timely updates regarding indicators that we may publish in future and give it a like if you appreciate the indicator.
